
Master Linux System Monitoring with dstat: The Complete Guide
Linux offers a variety of commands that give insights into disk and system activity as well as system resource stats. Among these, one of the most useful commands is dstat. This command provides a comprehensive array of detailed statistics concerning system activity.
If dstat is not installed on your Linux system, you can install it using a command similar to one of the following, provided you have root access:
For Redhat or similar distributions, use:
For Ubuntu, Debian, and related distributions, use:
Disk activity includes not just how full your disks are, but how busy they are as they are being read and written to by various commands that are being run. If you want to see just the disk read and write stats, use the -d option. Your output should look something like this:
Notice that the output includes one column for disk reads and another for disk writes.
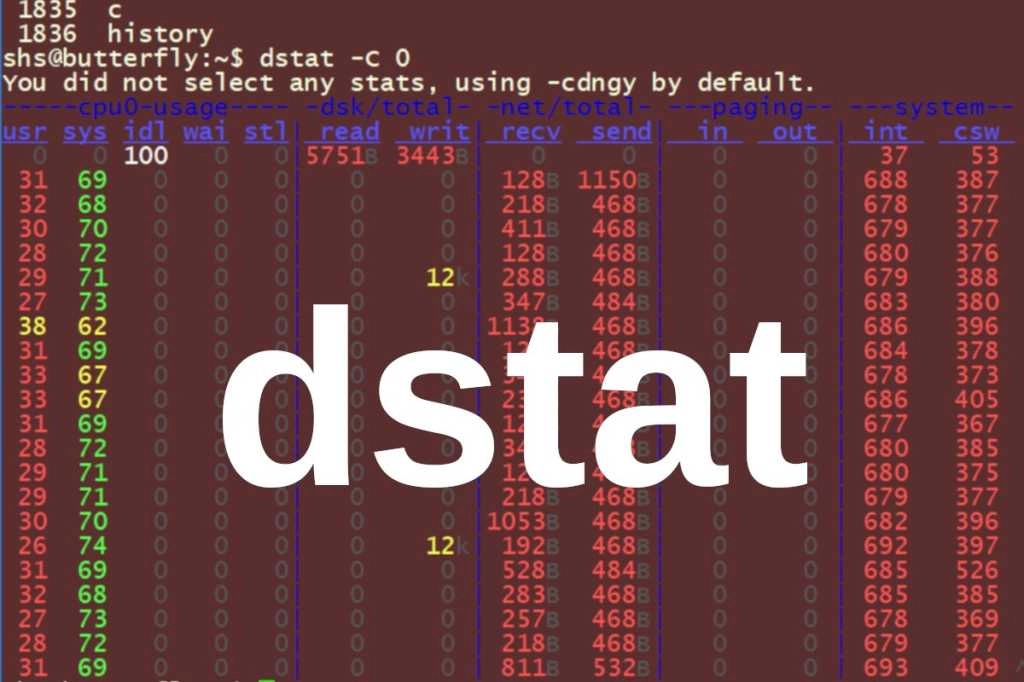
Were you to use the dstat command with no options, the output would include a lot more details than you might expect and would look more like what you see below.
Notice that this output includes stats usage, disk read and write, network activity, paging and system stats. The output from using dstat without options is the same as using dstat with the “cdngy” options (dstat -cdngy).
To get eight lines of this information in 2-second intervals, add the numeric arguments as shown in this command:
Note that the dstat command doesn’t always come with a man page. However, you can get a list of the command’s options and what each option represents using the dstat –help command.
The cdngy arguments (as you can tell from the output above) represent CPU, disk, network, paging, and system stats. To display used and free memory with dstat, use a command like this:
To display top CPU usages, you could use a command like this:
With the dstat -c (CPU) option, dstat displays CPU stats. In the example below, we’re asking for two-second intervals and six reports.
One key to becoming adept at evaluating system performance is to run commands like these periodically — even when you don’t see the need to question how well a system is running. If you come to know what normal performance looks like for a server, you will have a much easier time spotting problems.
The commands included in this post display some of the most useful dstat command options, but check the options list for others that will help you see the details that you most need to see. The dstat command provides a vast range of options for viewing system and resource stats.
Welcome to DediRock, your trusted partner in high-performance hosting solutions. At DediRock, we specialize in providing dedicated servers, VPS hosting, and cloud services tailored to meet the unique needs of businesses and individuals alike. Our mission is to deliver reliable, scalable, and secure hosting solutions that empower our clients to achieve their digital goals. With a commitment to exceptional customer support, cutting-edge technology, and robust infrastructure, DediRock stands out as a leader in the hosting industry. Join us and experience the difference that dedicated service and unwavering reliability can make for your online presence. Launch our website.