
How to Monitor Your VPS Performance Metrics Using Virtualizor
Meta Description: Learn how to track and optimize your VPS performance using Virtualizor. Discover how to monitor CPU load, RAM usage, disk I/O, and network activity to keep your server healthy and fast.
Introduction: Why VPS Monitoring Matters
Setting up your VPS is just the beginning. Keeping it running smoothly requires ongoing monitoring of your server’s performance metrics. Whether you’re hosting websites, applications, or game servers, performance issues like high CPU load, memory leaks, or disk bottlenecks can cripple your project — sometimes without warning.
This is where Virtualizor, a popular VPS management panel, comes into play. It provides an easy-to-use dashboard that lets you check vital stats in real-time without needing to log into the terminal or install third-party monitoring tools.
In this guide, we’ll dive deep into:
-
Why VPS monitoring is essential
-
How to monitor CPU, RAM, disk, and network health
-
What the numbers mean — and when to worry
-
Practical tips for optimizing your server after spotting issues
Ready to become a server monitoring pro? Let’s dive in.
️ Why Monitoring Your VPS Performance is Crucial
Here’s what happens when you don’t monitor your VPS:
-
Your server slows down gradually without you noticing.
-
Spikes in memory or CPU usage crash your applications.
-
Disk failures or I/O bottlenecks cause data loss.
-
Network problems lead to lost visitors or unhappy customers.
-
Security breaches go undetected until major damage is done.
On the other hand, smart monitoring means:
-
Identifying bottlenecks before they become disasters
-
Proactively scaling your server resources
-
Delivering a better user experience
-
Saving money by optimizing rather than blindly upgrading
In short: monitoring = better uptime, better performance, better business.
️ Virtualizor: Your VPS Monitoring Command Center
Virtualizor is a web-based VPS control panel that simplifies managing and monitoring your server.
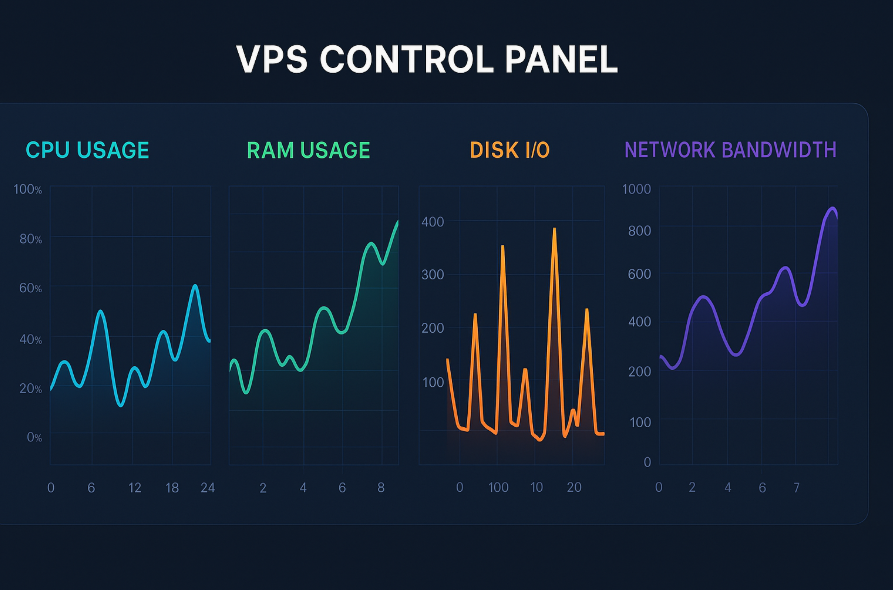
It provides visual dashboards showing:
-
Real-time and historical CPU usage
-
RAM and swap usage
-
Disk read/write (I/O) activity
-
Incoming and outgoing network bandwidth
-
Alerts for high usage
Plus, it’s available even on budget hosting plans where other monitoring tools cost extra.
How to Monitor Your VPS in Virtualizor (Step-by-Step)
Let’s walk through how you can easily keep tabs on your server’s health.
✅ Step 1: Log Into the Virtualizor Panel
-
Use the URL provided by your VPS host (typically something like
https://yourserverip:4083) -
Enter your username and password.
Tip: Bookmark the panel login for easy daily checks!
✅ Step 2: Open Your VPS Dashboard
After logging in:
-
Navigate to “List VPS” or “My VPS” section.
-
Click on your VPS to open the detailed dashboard.
Here’s where the magic happens. You’ll find performance graphs and real-time stats for CPU, RAM, disk, and network.
Key Metrics to Monitor
Now, let’s break down each metric so you know what you’re looking at — and what it means for your server’s health.
CPU Usage
Where to Find It:
In the Virtualizor dashboard under “CPU” graphs.
What It Shows:
-
How much processing power your VPS is using
-
Real-time and historical CPU load
Healthy Range:
-
Under 50% for low-load sites
-
Under 70–80% during peak loads
Red Flags:
-
Constant spikes above 90% = resource exhaustion
-
High idle CPU with high load = possible process bottleneck
Common Causes of High CPU:
-
Traffic surges
-
Poorly optimized applications (e.g., WordPress plugins)
-
Malware or DDoS attacks
Action: Identify top CPU-consuming processes (
toporhtop) and optimize or scale up your VPS plan.
RAM Usage
Where to Find It:
RAM and Swap graphs in your Virtualizor dashboard.
What It Shows:
-
How much physical memory is being used
-
How much swap memory (disk-based “emergency RAM”) is being used
Healthy Range:
-
Keep RAM usage under 70–80%
-
Swap usage should be near zero on a healthy server
Red Flags:
-
Swap usage consistently high = RAM shortage
-
Sudden memory spikes = memory leaks or runaway processes
Common Causes of High RAM Usage:
-
Large applications (Magento, WooCommerce, Node.js apps)
-
Memory leaks in poorly coded scripts
-
Database processes growing out of control
Action: Tune your apps, optimize database queries, or upgrade to more RAM.
Disk I/O (Input/Output) Activity
Where to Find It:
Disk graphs showing Read and Write operations.
What It Shows:
-
How often your server reads from or writes to storage
-
Disk speed efficiency
Healthy Range:
-
Moderate consistent reads and writes
-
Occasional spikes are fine during backups or file uploads
Red Flags:
-
Constant high disk usage = bottlenecks
-
Slow server responses during high disk I/O = read/write saturation
Common Causes of High Disk I/O:
-
Heavy database operations
-
Backup scripts
-
Log file explosions
-
Malware writing files uncontrollably
Action: Move to SSD-based storage if on HDDs, optimize database indexing, manage logs properly.
Network Activity
Where to Find It:
Network graphs for inbound and outbound traffic.
What It Shows:
-
Download (incoming) and upload (outgoing) traffic
-
Real-time and historic bandwidth usage
Healthy Range:
-
Depends heavily on your app (sites with video streaming will naturally use more)
Red Flags:
-
Sudden spikes in outgoing traffic = possible DDoS or server compromise
-
Constant incoming flooding = unwanted bot traffic
Common Causes of Network Spikes:
-
Traffic peaks
-
Updates/downloads
-
Hack attempts or DDoS attacks
Action: Implement rate limits, WAFs, and real-time firewalls if suspicious traffic is detected.
How to Read and Understand Virtualizor Graphs
Each graph typically shows:
-
Past hour
-
Past 24 hours
-
Past week
Look for patterns:
-
Consistent peaks = predictable busy times
-
Random spikes = need investigation
-
Flat lines = possible idle server (good for small projects)
Use this info to:
-
Schedule backups during low-usage hours
-
Plan for scaling if usage keeps growing
-
Troubleshoot slowdowns
️ Advanced Monitoring Tips
✅ Set Up Email Alerts
Many VPS providers offer email notifications for:
-
CPU overuse
-
Disk space critical warnings
-
Network abuse detection
Proactively monitor rather than waiting for downtime complaints.
✅ Monitor Disk Space Separately
Virtualizor focuses on disk I/O but not necessarily disk usage percentage.
-
Check free space with:
df -h
-
Clean temp files, old logs, or backups regularly.
✅ Use External Monitoring Services
For external uptime and performance tracking:
-
UptimeRobot
-
Better Uptime
-
StatusCake
Combine Virtualizor + external monitoring for full visibility.
Best Practices to Keep Your VPS Healthy Long-Term
-
Monitor weekly (at least)
-
Investigate and optimize after spikes
-
Patch and update software regularly
-
Scale vertically (more CPU/RAM) or horizontally (load balancers) if needed
-
Plan for high-availability if uptime is critical
✅ Final Thoughts: Monitor = Master Your VPS
Monitoring isn’t just for sysadmins — it’s essential for anyone serious about their website, app, or business.
Thanks to Virtualizor’s built-in metrics dashboard, you have powerful, real-time insights at your fingertips — no complicated setup needed.
-
Watch your CPU, RAM, disk, and network metrics
-
Understand what’s normal vs what’s a problem
-
Act early, scale smart, and avoid disaster
Your VPS is only as healthy as the attention you give it. Monitor wisely!