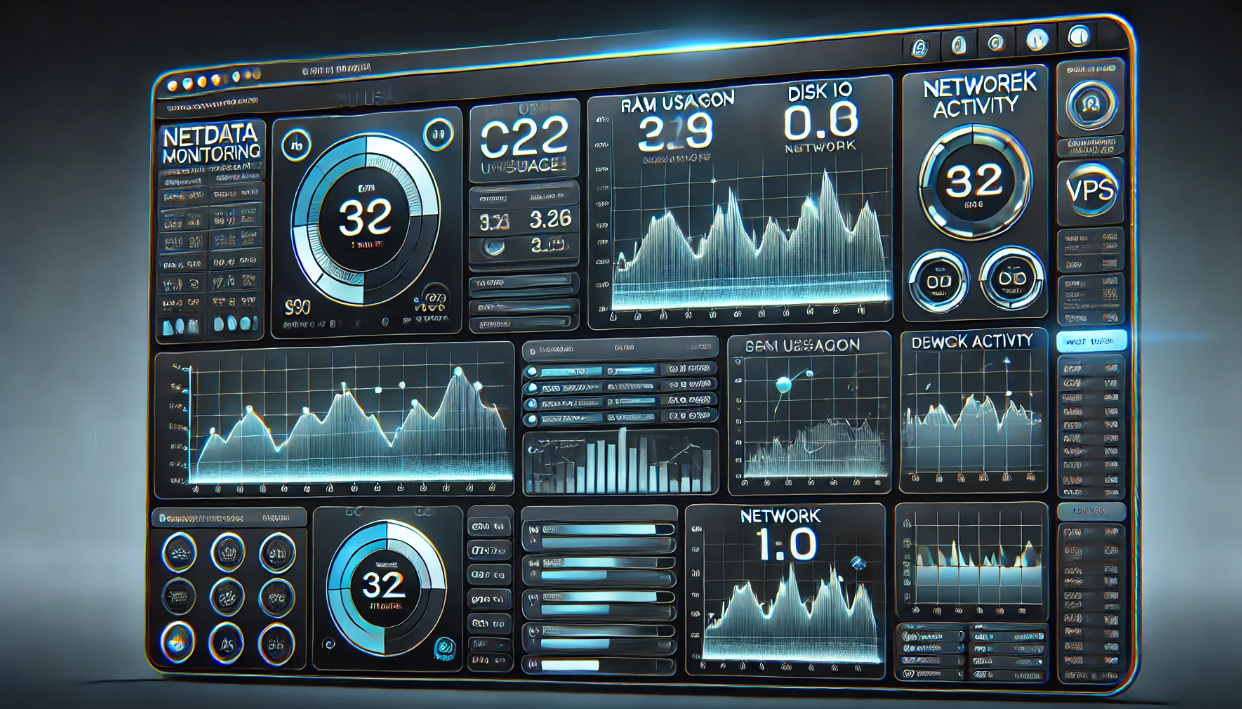
How to Monitor VPS Performance Like a Pro
Meta Description: Want to keep your VPS fast, secure, and online 24/7? Learn how to monitor your VPS performance like a pro using tools like htop, Netdata, Uptime Kuma, and more.
Why Monitoring Your VPS Is a Must
Setting up your VPS is just the beginning — the real magic happens when you monitor its health and performance consistently.
Whether you’re running a high-traffic website, hosting client projects, or just learning the ropes, real-time monitoring can help you:
-
Spot bottlenecks before they break your site
-
Track CPU, memory, and disk usage
-
Detect downtime immediately
-
Prevent security issues and overloads
And the best part? You don’t need to be a sysadmin to monitor like one.
Let’s explore the best tools and tactics to monitor your VPS like a pro.
⚙️ 1. htop – Real-Time System Monitor (CLI)
What It Is:
htop is the improved, colorful cousin of top — a terminal-based tool that gives you live stats on your CPU, RAM, swap, processes, and more.
Why Pros Use It:
-
Lightweight and fast
-
Easy to navigate with keyboard
-
Lets you sort by memory, CPU, PID, etc.
Use Cases:
-
Check for runaway processes
-
See which app is hogging memory
-
Monitor real-time system load during spikes
Tip: Use
htopfor quick health checks and when logging in over SSH.
2. Netdata – Full-Stack Monitoring Dashboard
What It Is:
Netdata is a real-time, web-based monitoring system that gives you interactive dashboards and per-second analytics for every part of your VPS.
What It Tracks:
-
CPU, RAM, swap, disk I/O
-
MySQL, NGINX, PHP-FPM performance
-
Network traffic, DNS, firewall events
Why It Rocks:
-
Gorgeous UI with animated graphs
-
Very low resource usage
-
Alerts for anomalies and thresholds
-
Easy one-line installation
Best For:
-
Visual learners
-
Long-term monitoring
-
Performance tuning and debugging
Pro Move: Install Netdata on every VPS you manage — it’s like a fitness tracker for your server.
3. Uptime Kuma – The Self-Hosted Status Page
What It Is:
Uptime Kuma is a self-hosted, open-source monitoring tool that checks whether your websites, services, or servers are online — and notifies you if they’re not.
Features:
-
HTTP(s), TCP, DNS, and Ping monitoring
-
Beautiful status page interface
-
Alerts via email, Discord, Telegram, Slack, etc.
-
Custom intervals, SSL certificate monitoring
Why Use It:
-
Know the moment your VPS or app goes offline
-
Impress clients with a branded status page
-
Monitor multiple sites or servers from one place
Bonus: You can deploy Uptime Kuma on the same VPS to monitor other endpoints.
️ 4. Glances – Cross-Platform Terminal Monitor
What It Is:
Glances is a command-line system monitor written in Python that adapts to your terminal size and displays system-wide stats in real time.
What It Monitors:
-
CPU and RAM usage
-
Disk I/O and space
-
Network bandwidth
-
Sensors (if available)
Why It’s Handy:
-
Web-based interface option
-
REST API for integrations
-
Remote monitoring supported
Think of Glances as a multi-tool for terminal-based resource tracking.
5. Fail2Ban + Logwatch (Bonus Combo for Security Awareness)
Not performance tools — but essential for VPS health.
-
Fail2Ban: Scans logs for suspicious login attempts and blocks abusive IPs.
-
Logwatch: Sends daily summaries of your logs — including usage, errors, and failed login attempts.
Combine these with your performance tools for full-spectrum VPS health tracking.
Choosing the Right Tool: At a Glance
| Tool | Best For | Interface | Resource Use |
|---|---|---|---|
| htop | Real-time CLI monitoring | Terminal | Very low |
| Netdata | Deep dive analytics | Web dashboard | Low |
| Uptime Kuma | Uptime & status pages | Web dashboard | Very low |
| Glances | Broad terminal monitoring | Terminal + Web | Low |
| Fail2Ban | Security monitoring | Logs + CLI | Minimal |
How Often Should You Monitor?
| Monitoring Type | Frequency |
|---|---|
| Resource usage (htop, Glances) | Weekly or during traffic spikes |
| Uptime (Uptime Kuma) | 24/7 (auto alerts) |
| Deep analytics (Netdata) | Ongoing background |
| Logs & security | Daily review or alerts |
✅ Final Thoughts: Monitoring = Server Mastery
Your VPS might be fast today — but what about tomorrow under stress?
Using tools like htop, Netdata, Uptime Kuma, and Glances, you can stay ahead of:
-
Crashes
-
Downtime
-
Security threats
-
Performance bottlenecks
Start small — install one or two. Over time, you’ll build a monitoring workflow that gives you insight, peace of mind, and pro-level control.

